Scope/Description
- This article covers increasing the Prometheus/Grafana logging period.
Prerequisites
- A working Ceph cluster running Ubuntu 20.04 with Ceph Octopus.
- Access to the cli of the admin/metrics node.
Steps
Extending Logging Period
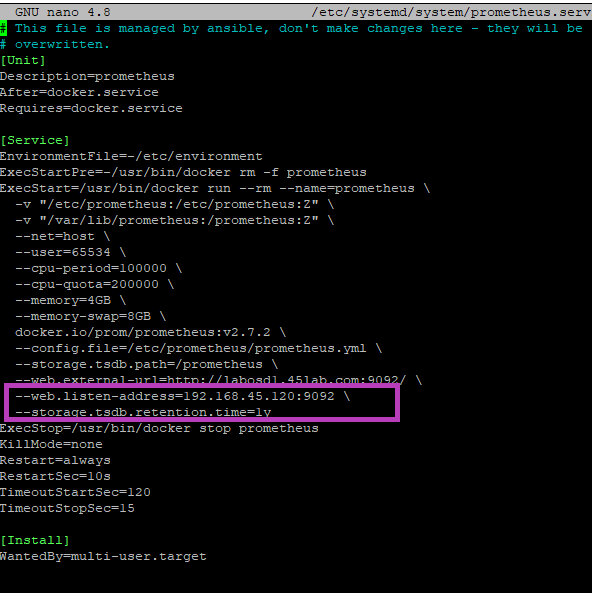
- Open /etc/systemd/system/prometheus.service in your text editor for choice and add the following line:
--storage.tsdb.retention.time=x
- Your config should now look like the below screenshot, substituting 1y for your desired time.
- Your retention period is now set though the actual log files are by default outputted to /var/lib/prometheus which pulls from the boot drives.
- To avoid having data on your boot drives it’s recommended to mount an rbd image to /var/lib/prometheus for additional storage
- We will also need to reload the systemd daemon to apply this change, you can do so with the commands below:
systemctl daemon-reload
systemctl restart prometheus
Providing Additional Log Storage
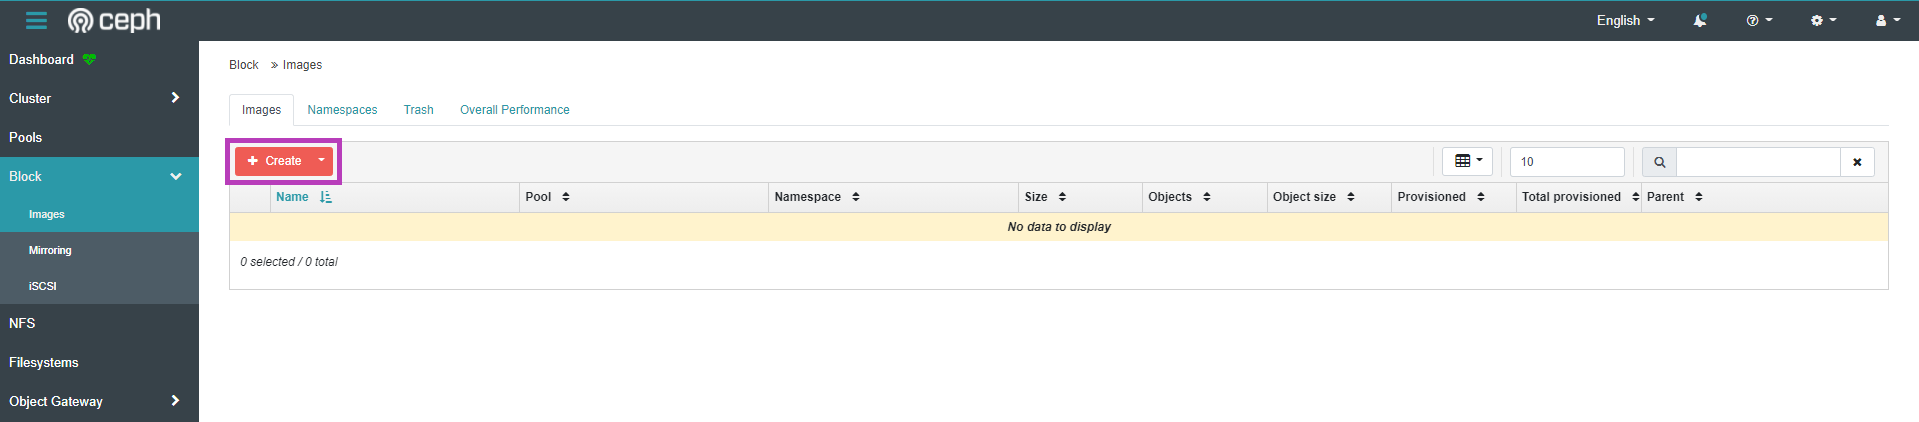
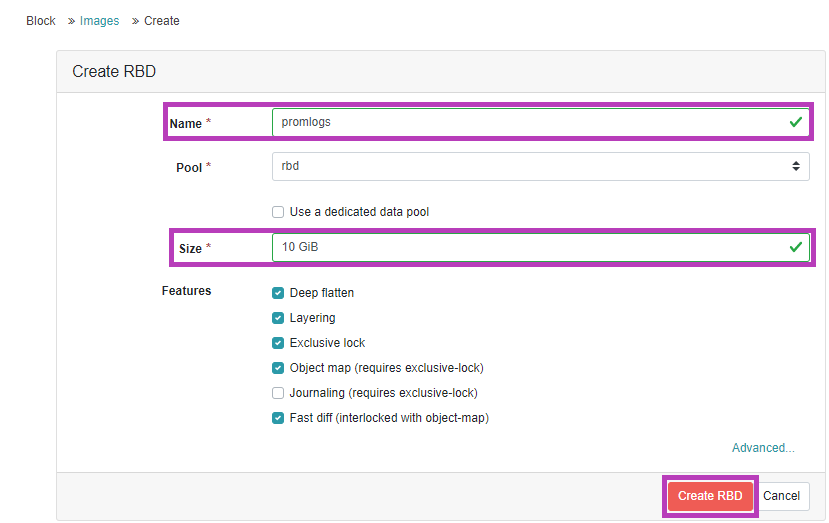
- Go to the Ceph dashboard and create a new block image.
- We will now need to map the newly created rbd image through the cli with the following command
rbd map rbd/promlogs --id admin --keyring /etc/ceph/ceph.client.admin.keyring
- Then we mount a filesystem with the following command
mkfs.ext4 -m0 /dev/rbd/rbd/promlogs
- Then mount this new rbd to /var/lib/prometheus. Note that any files inside /var/lib/prometheus will be removed in the process so make sure to back them up if you want them
mount /dev/rbd/rbd/promlogs /var/lib/prometheus/
- To make these changes permanent add the following line to /etc/ceph/rbdmap
rbd/promlogs id=admin,keyring=/etc/ceph/ceph.client.admin.keyring
- We will also need to edit /etc/fstab with the following line
/dev/rbdX /var/lib/prometheus ext4 defaults,_netdev 0 0
Verification
To verify that the mount has been successful we can run the ‘df’ command. The output should show the block device mounted to /var/lib/prometheus

Troubleshooting
- Ensure that the owner user/group of the /var/lib/prometheus directory matches up to the UID specified in the Prometheus service file.
Views: 620