Scope/Description
This article describes the results of the power draw of Storinator.
See the following links for more detailed power analysis:
Power Analysis Part 1 (Consumer Drives)
Power Analysis Part 2 (Effects of Staggered Spin Up)
Power Analysis Part 3 (Enterprise Drives)
Startup Power Draw
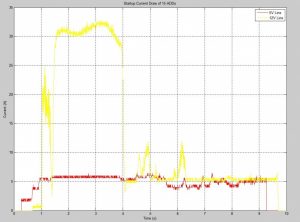
The following graphs are of the current draw and the power draw of 15 hard drives loaded into the Storinator. We chose to measure 15 drives as that was a good base line for showing the startup surges for the 30, 45, and 60 unit Storinator, just multiply the numbers in the plots below by 2 for the 30 pod, 3 for the 45 pod and 4 for the 60 pod.
It is important to note that the drives we chose to measure were our “worst case scenario” drives. These are Enterprise level drives (1 TB Seagate Constellation ES.3) that draw alot of power
To measure the DC power consumption of the HDDs a clamp current meter was used to measure both the 5V line and the 12V line. The output of the current clamp was fed into an amplification and filtering circuit which was then observed on a oscilloscope.

DC Power Draw 15 HDDs (Total 5V & 12V lines)
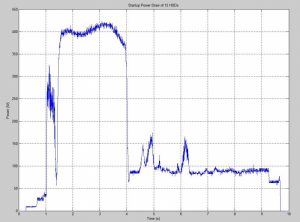
Here is a 10 second capture of total DC power draw (Watts) for 15 HDDs (ST10000NM0033).
You can see that the initial 4 seconds are the most taxing on the PSU, however quickly settles into steady state operation after about 6.5 seconds.
Note that this plot is for 15 very power hungry enterprise HDDs, most consumer drives are not this demanding.
However it is clear that for a very short time HDDs pull a lot of power! scale this up for a full XL60 and you can have startup draws up to 1600W.
This is when enabling staggered spin up (SSU) on your drives comes in, you can reduce the maximum power peak significantly. Please see this page on more detail on how SSU works in our machines and how to turn it on. Staggered Spin Up
