Table of Contents
Scope/Description
This article will cover resolving issues with clock skew on PetaSAN. These issues are often displayed on the dashboard and can be referenced in the ceph.log file
Prerequisites
- PetaSAN Clustered solution
- SSH Access
- PuTTy or some other form of SSH client
- Cluster reporting “Slow/Blocked Ops” or “Clock Skew”
Steps
- Verify that the issue regarding Slow Ops is related to clock skew. This can be done by accessing the command line through SSH using the root account.
cat /var/log/ceph/ceph.log | grep -i clock
- The output should list off all entries in that log which contain the word ‘clock,’ which in this case, would be clock skew.
If there are entries mentioning clock skew, continue with the rest of this article.
- We’ll be doing this process on each node in the cluster. Start with:
service ntp stop

ntpdate [IP of NTP Server]

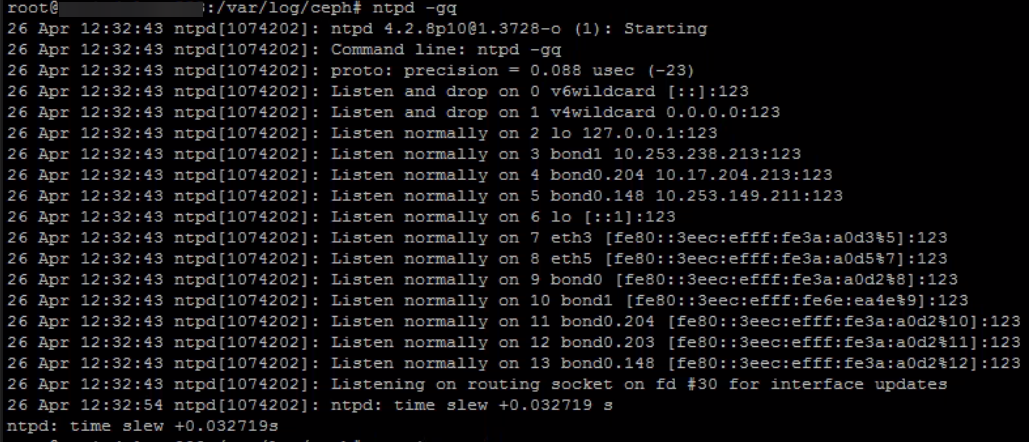
- Now, run ntpd -gq. This command may take some time resolve and have a long output, allow it to finish.
ntpd -gq

- From here, restart the ntp service, then restart the monitor service.
service ntp start

systemctl restart ceph-mon@[Monitor host name]
![]()
Verification
Run date on each server. The times should be synced. Keep an eye on the cluster to see if clock skew occurs again, using the ceph.log file to assist with monitoring.
Views: 772