Scope/Description
This article will show how to install and configure a monitoring, alerting and metric stack in Ubuntu 20.04 and Rocky Linux 8 using ansible.
More information can be found here.
Prerequisites
- Ubuntu 20.04 or or Rocky Linux 8 installed
- Houston UI
- Ansible installed
Steps
- Login to Houston and open the Terminal.
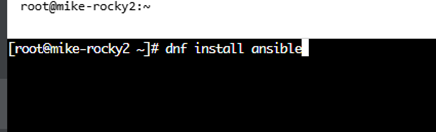
- Download ansible using the following commands:
Rocky Linux: dnf install ansible
Ubuntu: apt install ansible
Generate “ssh key” and copy it to the server.
ssh-keygen <Press enter for each line>
ssh-copy-id localhost
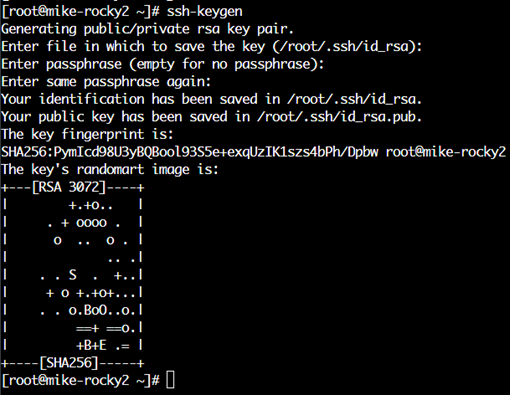
- Once the ssh key is generated, copy the file to the server to be able to access via ssh with no password.
ssh-copy-id hostname (replace hostname with your server hostname)
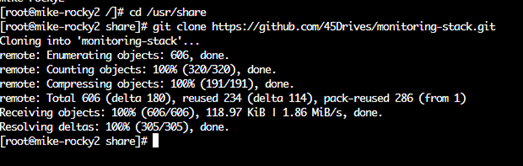
- Next, install monitoring-stack playbooks from github. From the terminal, enter the /usr/share directory:
cd /usr/share
- Then enter the following command to install the monitoring stack from github:
git clone https://github.com/45Drives/monitoring-stack.git
- After the monitoring stack playbooks have been installed, a new directory will be made for the monitoring stack. Enter the new directory
cd /usr/share/monitoring-stack.
cd /usr/share/monitoring-stack

Make ‘sh’ executable by running: bash init.sh
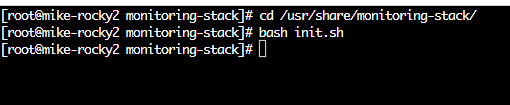
Default values will do for majority of cases. See github readme for more options.
- Edit the metrics file to configure email send/receive variables for receiving alerts
vim /usr/share/monitoring-stack/group_vars/metrics.yml
This file can also be edited with nano, if preferred:
nano /usr/share/monitoring-stack/group_vars/metrics.yml
- If using gmail, slack or another supported alert destinations leave the defaults alone. Manual configuration required.
vim group_vars/metrics.yml
Note: If using vi to edit, some basic commands are:
-
- ‘I’ allows the user to make changes
- ‘Esc’ can be used once document editing is complete
- ‘:wq’ allows the user to exit.
If using nano, navigation can occur with the arrow keys, with changes being made using basic keyboard functions. Exit by hitting ctrl+x and then hit enter to save.
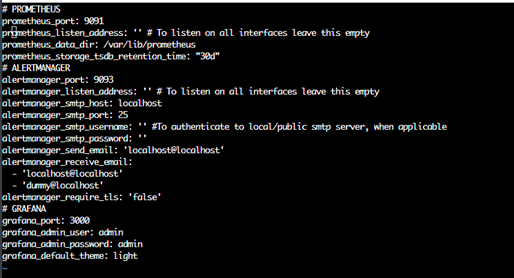
- The primary areas a user will want to edit:
alertmanager_smtp_host: <email server hostname or IP>

alertmanager_smtp_port: <email server smtp port>

alertmanager_send_email: <email address that sends alerts>

alertmanager_receive_email: <email address that recieves alerts>
multiple email address can be specified as [email0, email1, email2, … email9]
- If using a public smtp server or need to authenticate to a local mail server, you will need to input the username and password. Leave variables empty in the case it is not needed. See parameters below.
alertmanager_smtp_username: 'username'
alertmanager_smtp_password: 'password'
- Run playbook to deploy monitoring stack
ansible-playbook -i hosts deploy-monitoring.yml
Verification
- Users should now be able to access the web UI for each part of the monitoring stack. Change the port in your browser from the Houston UI port :9090 to one of the following:
Prometheus Port :9091 Alertmanager Port :9093 Grafana Port :3000 Node Exporter Port :9100 - Note: These interfaces do not support SSL by default. When navigating to the port users will need to use “http://” not “https://”. This can be avoided entirely by going to (user ip address):9091 etc.
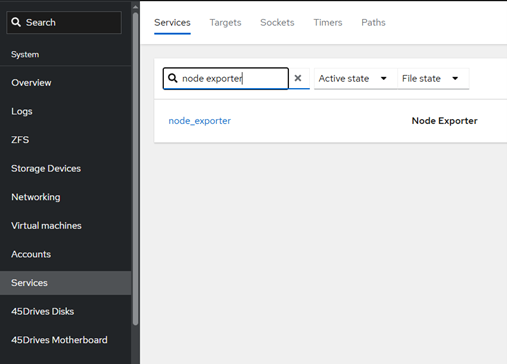
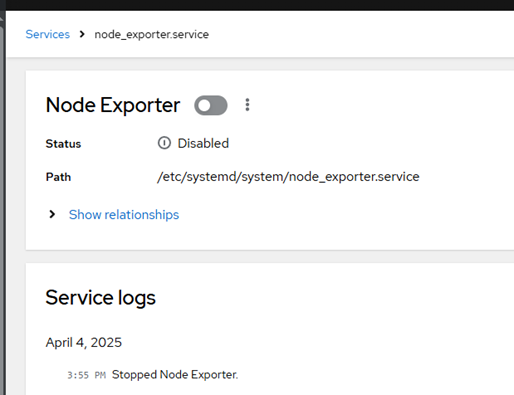
- To verify that the emails will work, offline node exporter. Node exporter is part of the alert stack and will not affect any operations running on the server. This can be completed through the Houston UI with the following path:
Services Tab > search for node exporter > select node_exporter > select the slider to turn off the service
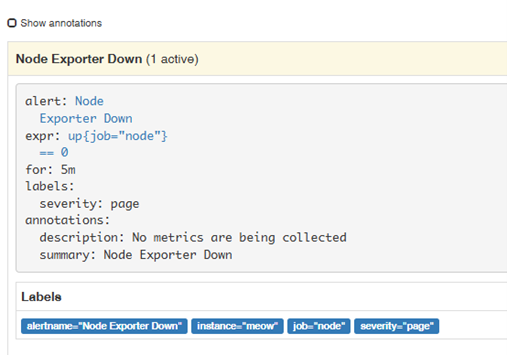
- After the service is turned off, navigate to the Prometheus UI (IP address:9091), select alerts from the top, and an alert will be present for Node Exporter
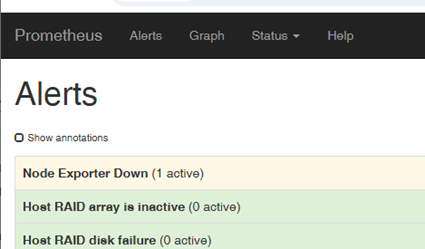
- Details about the default alerts can be added here. Selecting an alert will show the amount of time before the alert will fire. In the example below for “Node Exporter Down”, the alert takes five minutes before an email would be received.
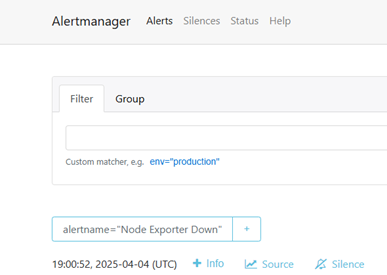
- After five minutes an email should be received, but users can also open alertmanager (ipaddress:9093) to view the alert
Troubleshooting
- If the alert does not appear in email, check the status of alert manager in the Houston UI. This can be viewed under the Services tab or by running the command:
systemctl status alertmanager
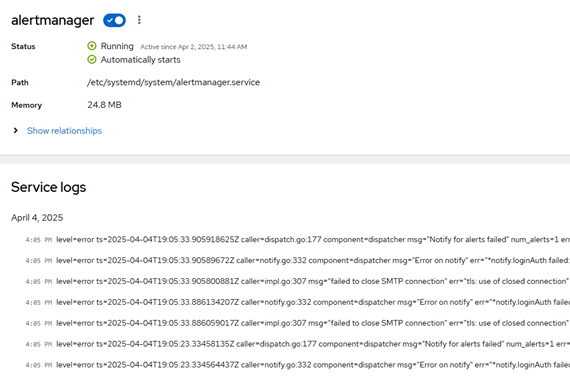
- The error above will display in alert manager if the emails are failing. Users will need to double check their smtp server and/or email information.
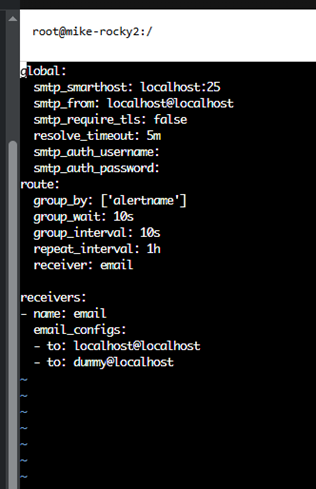
- Editing this does not require running the ansible playbook again. Users can simply edit the alertmanager configuration file, using the commands below, and restart the service to attempt the email again:
vim /etc/alertmanager/alertmanager.yml

nano /etc/alertmanager/alertmanager.yml
- Once these files are updated to the new configuration, users can restart alert manager through the Service tab in Houston UI or through the terminal using the following command:
systemctl restart alertmanager
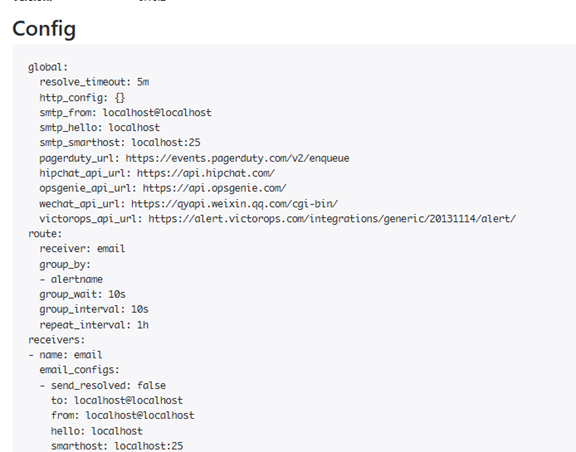
- Once alertmanager is running, the configuration has been changed to go to the alertmanager page.
- Select Status from the top and scroll down to view your configuration.
- If necessary, monitoring stack can be uninstalled back to a fresh state with
ansible-playbook -i hosts purge-monitoring.yml
- If using a Gmail account you may need to turn less secure access on for your account.