Table of Contents
Scope/Description
This guide covers the creation of Grafana Graphs at a base level which can then be used to pull and manipulate data for any purpose.
Prerequisites
- A working ceph cluster
- A defined metrics server
- Access to the Grafana dashboard
Steps
- Navigate to your grafana dashboard, typically this will be on port 3000 of your ceph admin server.
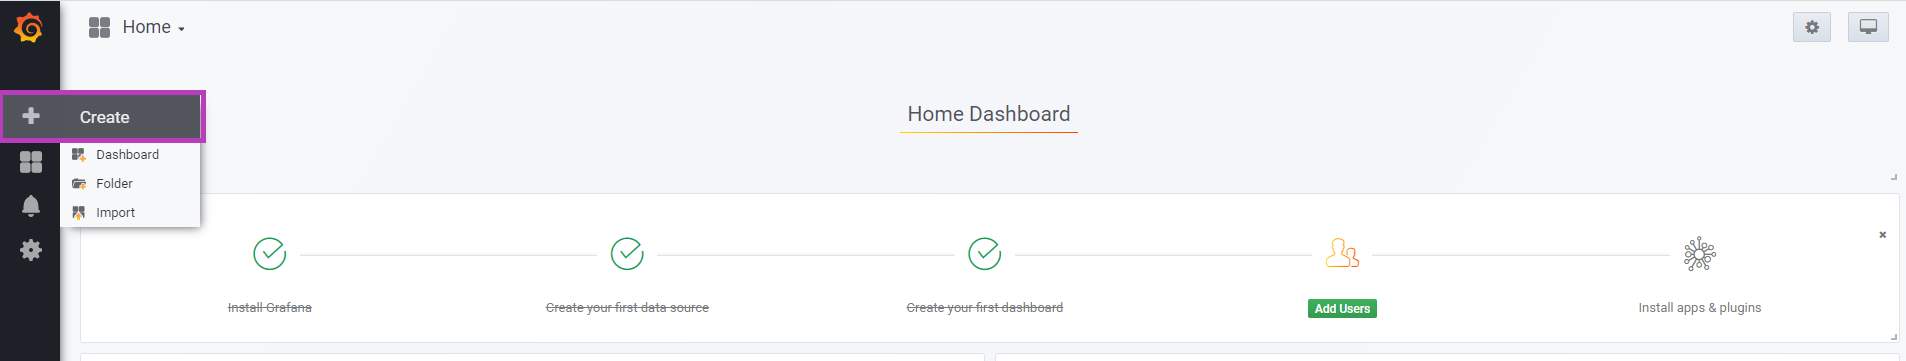
- On the Grafana dashboard there is a “+” icon where we can create new graphs and dashboards, a picture of this is shown below:
- Selecting Dashboard in the create menu leads to a page with a number of options, each of these provides their own data format. For our purposes we will be creating a graph. Selecting the graph option opens the below window
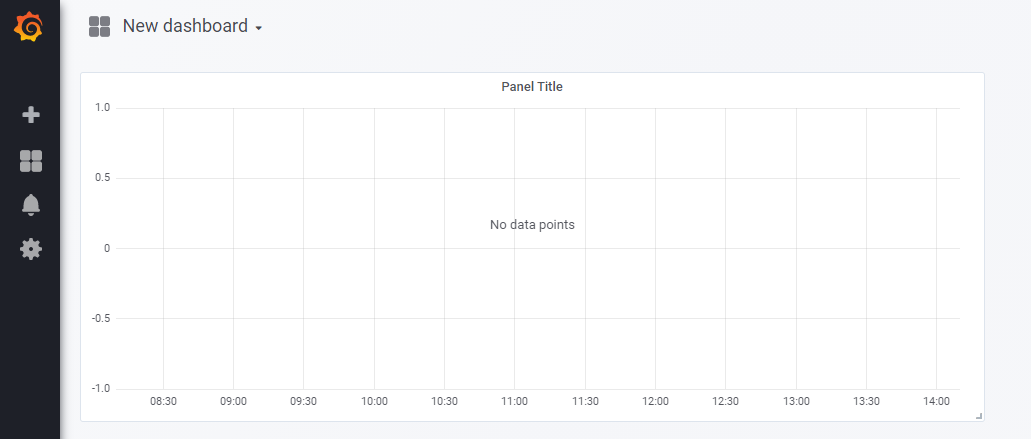
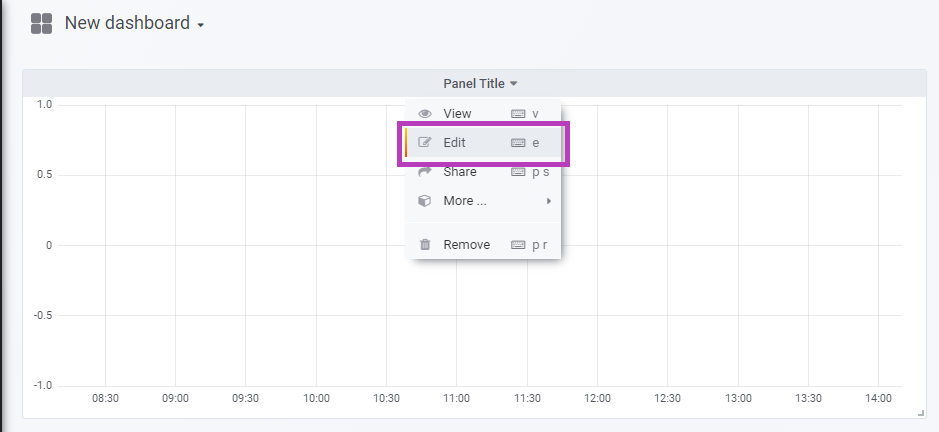
- This is a blank graph that is not pulling any data- in order to add data to the graph we will need to edit it. This is done by left clicking the “Panel Title” and selecting edit.
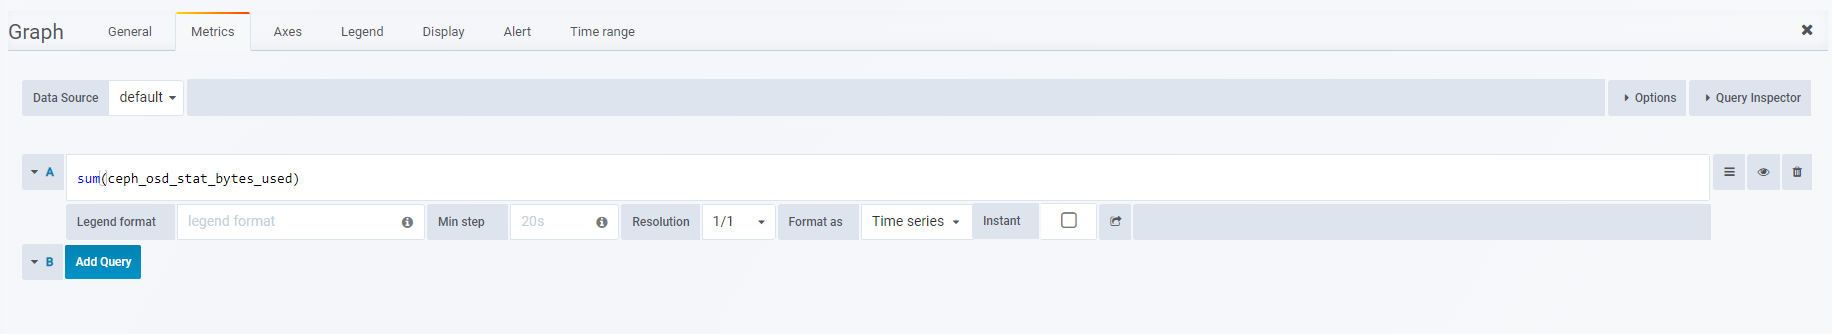
- In the edit menu you can go to the “Metrics” tab to define what data you wish to pull for the graph. Most of the relevant data can be viewed by typing “ceph_” into the provided textbox. This shows a list of all ceph related data sources. For our purposes we will select “ceph_osd_stat_bytes_used” and create a cluster usage over time graph. In order to get the entire clusters data we will need to sum together the “ceph_osd_stat_bytes_used” metric as shown below:
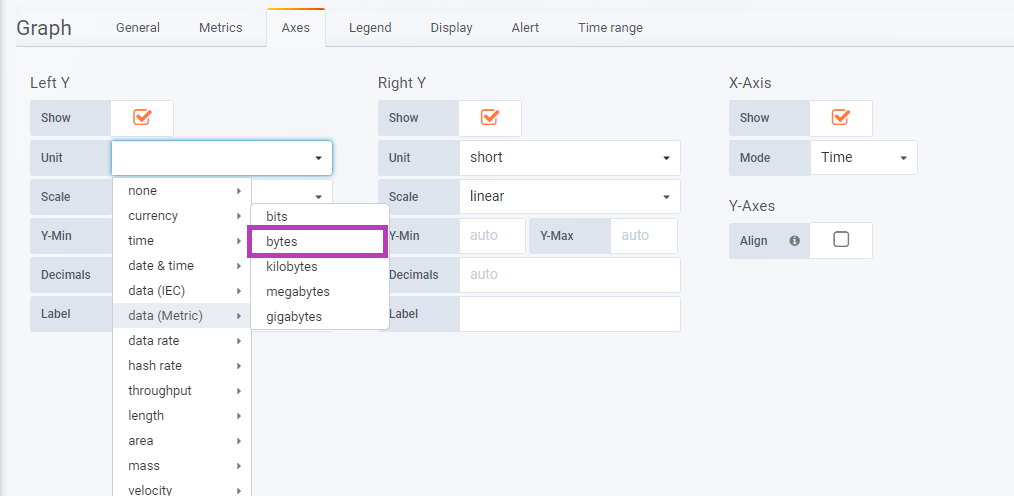
- We will now need to define what our axis’ are- currently the graph displays total usage over time but not in any data recognizable units. Under the “Axes” tab we can set various units. As we are measuring data we will set our Y access to be “data (metric) bytes”. We can leave our X axis as time.
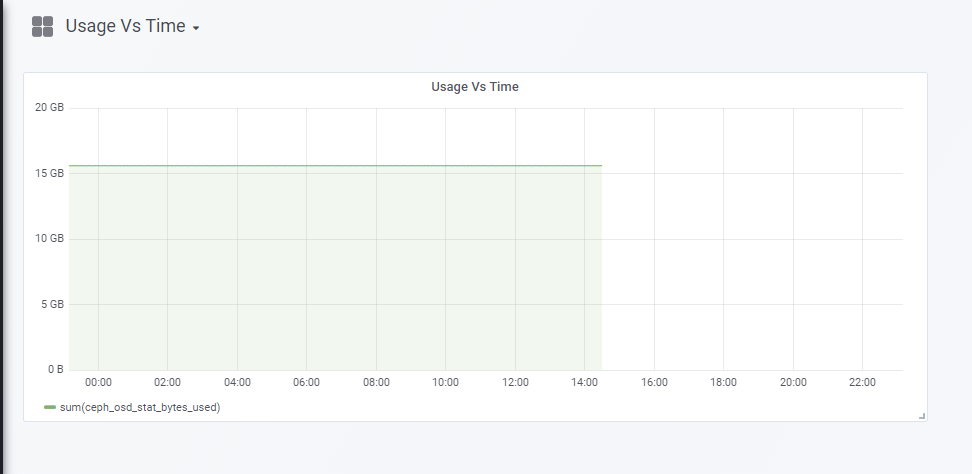
- Under the general tab we can change the graphs title and description, which we will set as “Usage vs Time” for this example.
- Once finished click the Save icon at the top right of your dashboard. This will open a window where you can select which folder to place the graph, and what to name the dashboard.
Verification
- If the graph was created successfully you will now be able to view it as you would any other dashboard. Our example dashboard is shown below:
Troubleshooting
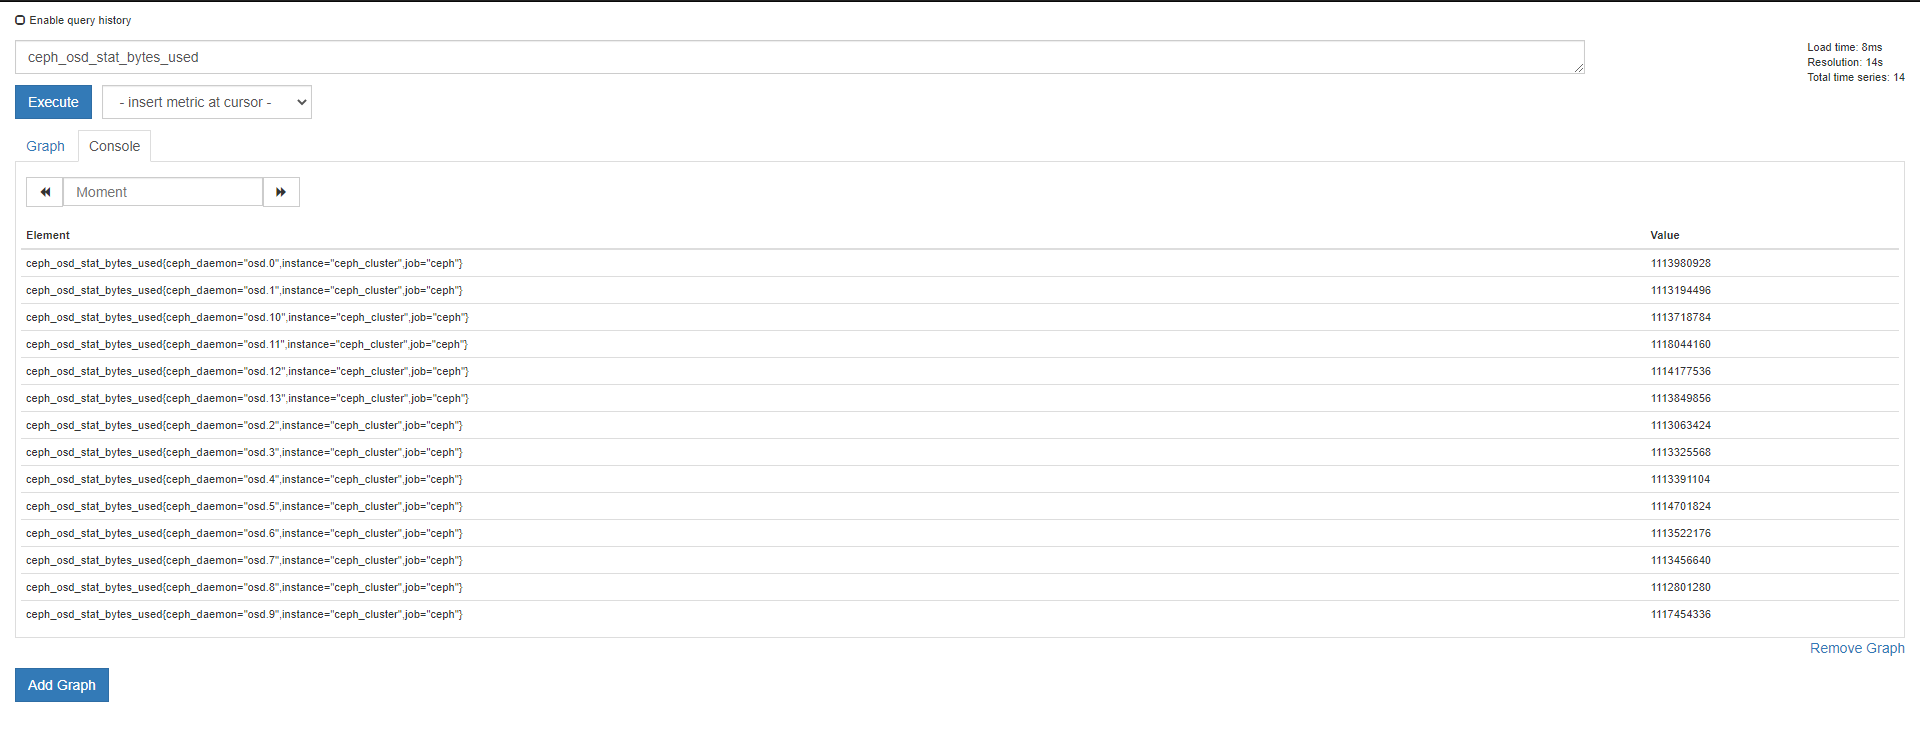
- If your graph is not displaying the data you were expecting you have likely pulled from the wrong data source. An entire list of data sources in json format can be found at port 9092 of your grafana dashboard.
- In the graphs tab enter the data source you are using and hit execute to see where that information is pulled from
Views: 1058